Business Intelligence Reporting
Effectively collect data and transform insight into action
You will be confident of your business outcomes through using our range of Business Intelligence Reporting Dashboards. Each one is designed to give you the insight you need through easy-to-understand and digest reports.
Our Business Intelligence Dashboard options:

Freight Costs & Activity Dashboard
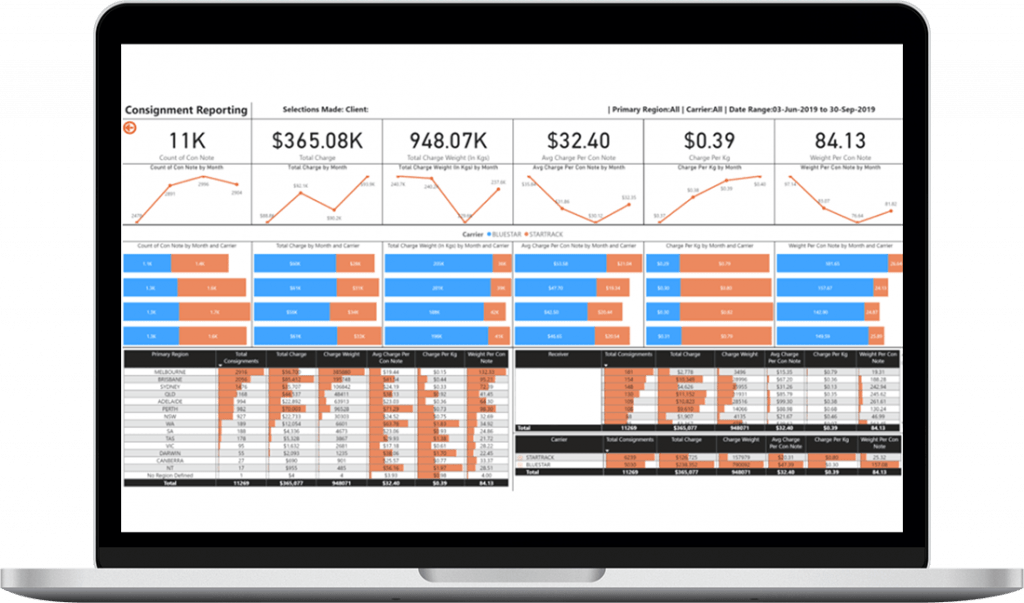
Importing reconciled data from our Carrier Invoice Reconciliation Service, this BI Dashboard provides improved visibility on your true freight costs. It also shows what you are shipping, where to, etc., both nationally and by individual site location.
All you need to do is login to your dedicated, secure dashboard whenever you want to monitor your freight costs and activity via a real time, interactive MS Power BI Dashboard.
This dashboard provides data in easy to interpret tables and graphs, you can drilldown on any field in the dashboard to isolate any data of interest.
You can filter the data to create/highlight a specific report that you can then download straight into a PowerPoint presentation or as a pdf.
Freight Costs & Activity Reports
This Dashboard Reports are organised by:
- Warehouse Site Location: From
- Receiver Location: To – ‘Primary Region’
Within these parameters you can see:
- Metrics such as Average & Total Cost per Kgs
- Trending data
- Drilldown on Carriers and Services
- Breakdown of ‘Per Region’ KPIs
- Customer KPIs
- Carrier KPIs

Freight Enquiry Dashboard
Our Freight Customer Service solution is available to any shipping organisation that needs to outsource because of time and resource issues.
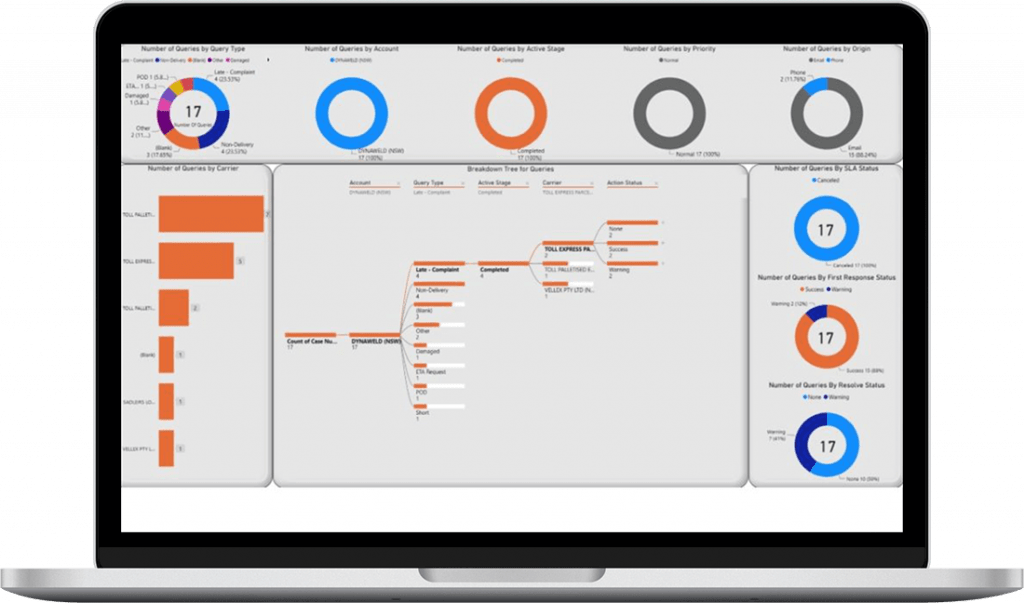
The Freight Enquiry Dashboard is your window into how your Customer Service team is performing.
It also shows how your Carriers are performing with resolving issues, delivering on time, and helping increase your Customer Satisfaction capabilities.
Here is where we tap into our 40 years of expertise in managing freight queries (such as PODs) for efficient, transparent customer service tasks.
Freight Enquiry Reports
This Dashboard includes Ticketing Queries metrics such as:
- Number of Queries
- Types of Queries
- Escalated Queries
- Time to Resolve
- POD
- Carrier KPIs on above
- Query Categories
- National KPI data as well as NDC / Branch-level data
- Customer / Receiver-level query data
- Trending Data

Delivery Status Dashboard
Our Delivery Status Dashboard is a cutting-edge solution for the Australian Transport Market.
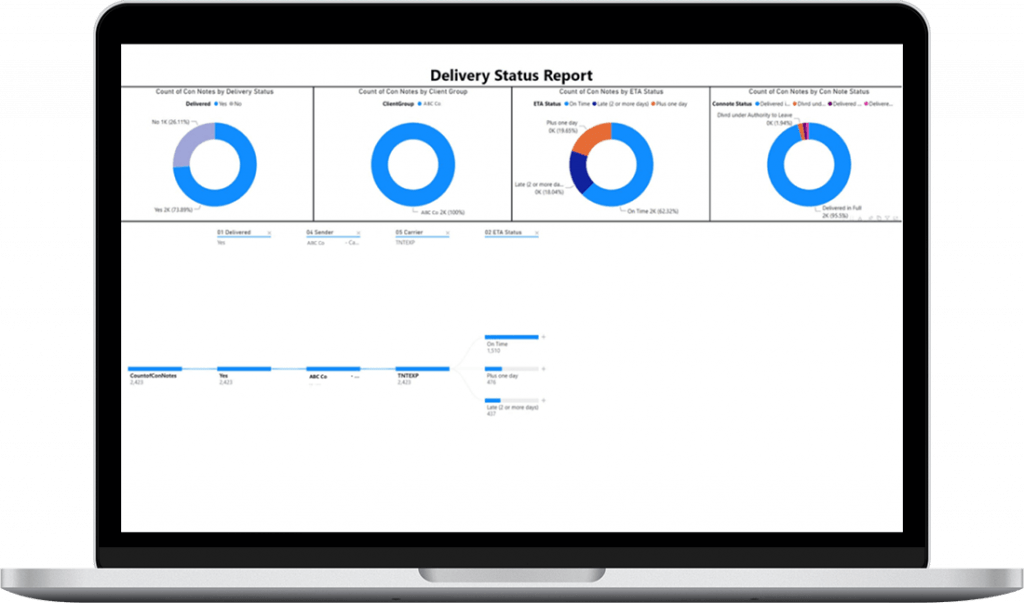
Capturing real time hard data via API connection with first tier carriers, it provides you with independent and accurate data on Delivery Status KPIs.
This Dashboard provides easy to interpret charts to show you exactly how well your carriers are performing for safe and efficient delivery of your goods to your customers.
This cloud-based system can be viewed anywhere – at the office or your laptop at home.
We also provide a DIFOT (Direct in Full On Time) table report that you can view, and filter to prioritise metrics.
Delivery Status Reports
The Dashboard has filters for reporting on:
- KPIs by Group, Branch, and Carrier
- Delivered vs. Non-Delivered
- ETA Status type e.g. On Time, Plus One Day, 2+ Days
- Delivery method type e.g. Agent, ATL, In Full
What is included in this solution?

Freight Data Warehousing
Your freight data becomes more valuable over time as it builds upon your freight profile with fresh data every month.
This warehouse data is then available to you and your team for further insight into your freight business costs and activity reports such as trending reports, for example: Year on Year reports.
It is also available to be used for your next Freight Tender. Warehousing your data for years provides a wealth of data for the next Freight Review process. It incorporates analytics of your freight profile and enables a benchmarking process.

Carrier Check
All three BI Dashboards are modules of our back-office Carrier Check System.
- Freight Costs & Activity is part of our Freight Auditing & Carrier Invoice Reconciliation Carrier Check system.
- Freight Enquiry is part of our outsourced Customer Service System.
- Delivery Status combines Carrier Check data and scanning events from carrier APIs to provide independent data.

Freight Management Turnkey Solutions
Our range of freight management solutions provides you with a turnkey solution that streamlines your freight processes and optimises your freight spend.
These solutions include:
- Freight Auditing, Carrier Invoice Reconciliation
- Freight Enquiry
- Delivery Status
- Freight Tenders & Management
Our System smarts and expert team, smooth out the complexity of your business, enabling you to focus on your core tasks, and your customers.
Want to learn more?
Book your free freight review consultation meeting or online demonstration today.
"*" indicates required fields
